Key Takeaways
Dell ( DELL ) shares tumbled in extended trading Tuesday after the server and personal computer maker reported fiscal 2025 third-quarter revenue that came in below Wall Street expectations.
During the earnings call, the company guided revenue for the January quarter of between $24 billion and $25 billion, falling short the $25.6 billion expected by analysts. While the company reported record artificial intelligence (AI) server orders in the latest quarter, it cautioned about apprehensive customers in its legacy personal computer and storage businesses, potentially weighing on investor sentiment.
Dell shares fell 11% to $125.75 in after-hours trading. Through the close of regular trading Tuesday, the stock had gained 85% since the start of the yea, significantly outperforming the S&P 500’s 26% return over the same period.
Below, we take a closer look at the technicals on Dell’s chart and identify important price levels that investors may be watching out for.
Rising Wedge Pattern
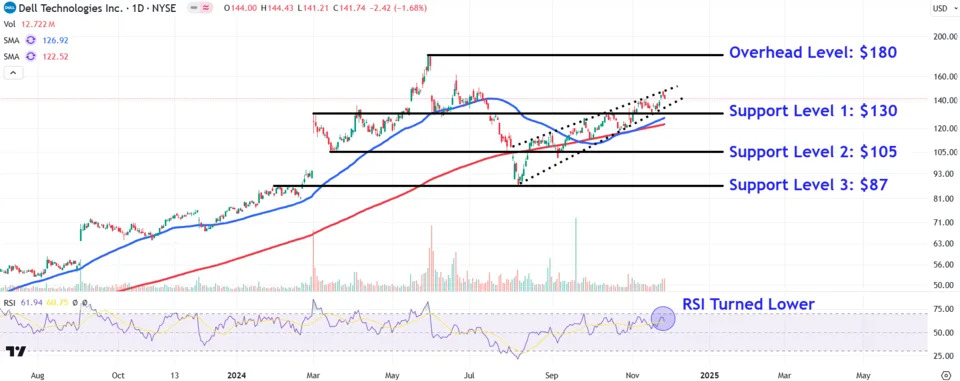
Since bottoming out below the 200-day moving average (MA) in early August, Dell shares have trended higher within a rising wedge , a chart pattern that may signal a potential reversal upon a breakdown below the formation’s lower trendline.
While the relative strength index (RSI) indicates positive price momentum with a reading above 60, the indicator turned downwards ahead of earnings as the stock’s price ran into selling pressure near the rising wedge pattern’s top trendline.
Let’s apply technical analysis to locate three key support levels on Dell’s chart and also point out an important overhead area to watch if the stock continues its longer-term uptrend .
Key Support Levels to Watch
The first level to eye sits around $130, a location where investors could look for buying opportunities near a trendline that connects multiple peaks and troughs on the chart between March and November. This area also may find support from the rising 50-day MA.
A breakdown below this level opens the door for a decline to the $105 region. This area on the chart could provide support near the prominent March swing low , which closely aligns with a series of price levels positioned just above the early-September trough.
Further selling could see the shares revisit lower support around $87. Investors may seek buy-and-hold entry points at this level near two minor February twin peaks and the deep early-August swing low.
Important Overhead Area to Monitor
Upon a resumption of Dell’s longer-term uptrend, it’s worth keeping track of the $180 level. Those who have purchased shares at lower prices could look to lock in profits at this location near the stock’s all-time high (ATH) .
The comments, opinions, and analyses expressed on Investopedia are for informational purposes only. Read our warranty and liability disclaimer for more info.
As of the date this article was written, the author does not own any of the above securities.


