This week, I’m listing some charts I regularly monitor, where I price the stock market in alternative assets like gold, oil, etc. This approach helps identify early shifts into or out of these assets and highlights the ever-shifting opportunity cost of stock investing. For instance, while the S&P 500 Index (SPX) hit new highs in 2013, it was still down 80% from its peak when priced in ounces of gold. Investors using cash may have been satisfied, but those selling gold to buy stocks or who decided to buy stocks instead of gold, had regrets.
Stocks Priced in Gold, Silver
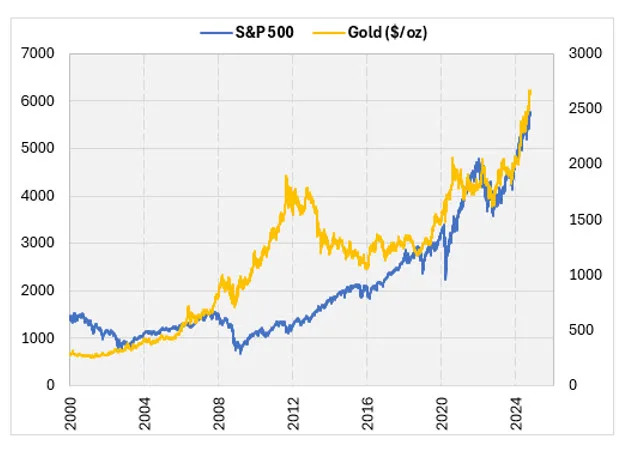
Here is a chart of the S&P 500 along with gold since 2000. Gold topped out in 2011 after a meteoric rise and tumbled over the next few years as the S&P 500 rose significantly. The S&P 500 accelerated even higher as gold hit a multi-year low in 2015. Since 2018, stocks and gold have both rallied in concert, especially over the past couple of years.
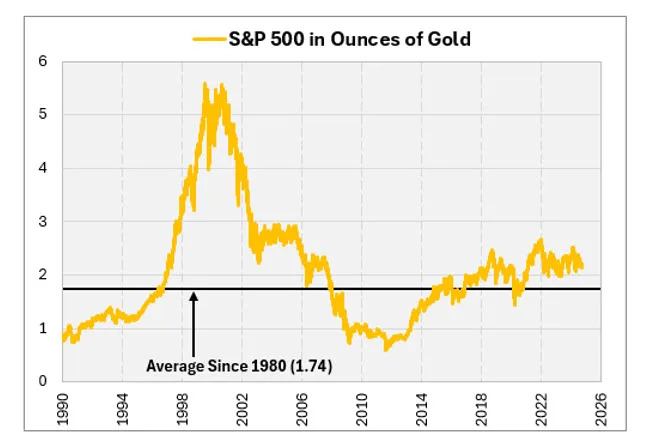
When the assets move in opposite directions, it’s easy to know which one did better. When both move in the same direction, it depends on the magnitude of the move, which is harder to see on the chart above. The chart below, which prices the S&P 500 in ounces of gold instead of dollars, makes it clearer. When the line moves higher, the S&P 500 would be the preferred investment. When it’s moving lower, gold would be preferred. I also have the long-term average of the S&P 500 per ounce of gold on the chart for historical reference. From mid-2011 through mid-2018, the S&P 500 soared from 0.6 ounces of gold to 2.4, an annualized rate of return of about 22% in those seven years. Since then, the S&P 500 fell briefly below its long-term average of 1.74 ounces of gold. Over the past couple of years, the S&P 500 has maintained it’s value just above two ounces of gold.
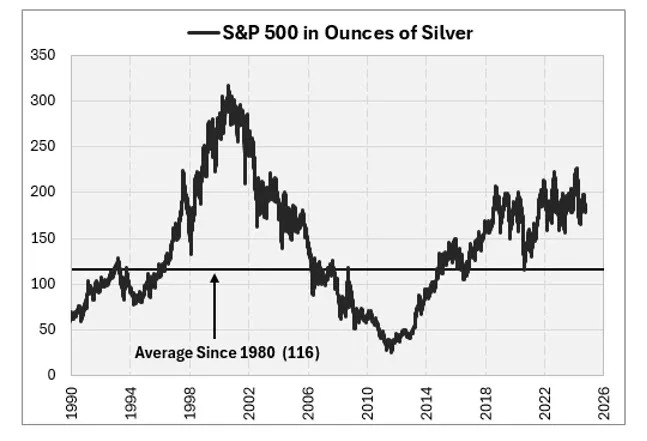
Pricing the S&P 500 in ounces of silver looks a lot like the chart above. The rise from mid-2011 through mid-2018 was even more steep, when priced in ounces of silver with an annualized return of 32%. Thus, the S&P 500, when priced in gold, sits about 24% above its long-term average. When priced in silver, it’s close to 54% above its long-term average.
Dr. Copper Will See You Now
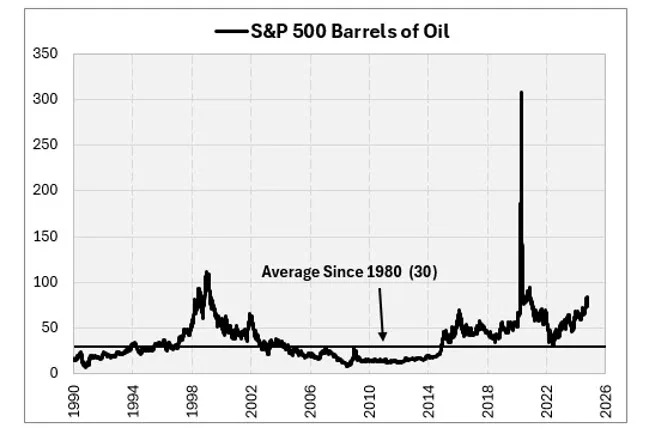
If you’re not valuing the S&P 500 in dollars, then gold and silver are the natural choice. They have been used as currencies in the past. You can, however, value the stock market in anything. The chart below shows the number of barrels of oil it would take to buy the index. In the early stages of the coronavirus, most of us recall stocks crashing. If our currency was barrels of oil, however, it was a short-lived stock market bubble. Oil crashed so hard that some futures prices went negative, as producers, lacking a way to store the oil, were paying buyers to take the oil. Since then, stocks fell when priced in barrels of oil, touching their long-term average in mid-2022. That turned out to be the bottom and the S&P 500 has risen 144% over the past couple years in barrels of oil.
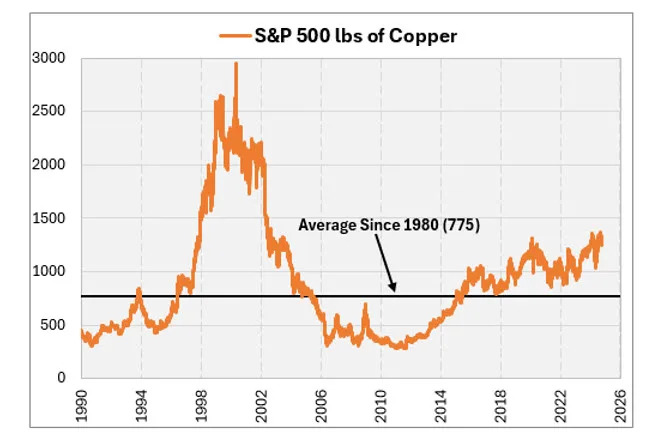
Copper is often referred to as Dr. Copper because, according to Investopedia, it is said to have a Ph.D. in economics and can predict turning points in the global economy. The chart below prices the S&P 500 in pounds of copper. This chart is also rising; since 2022 stocks have outpaced copper. The index, in pounds of copper, sits about 60% above its long-term average.
What About Bitcoin?
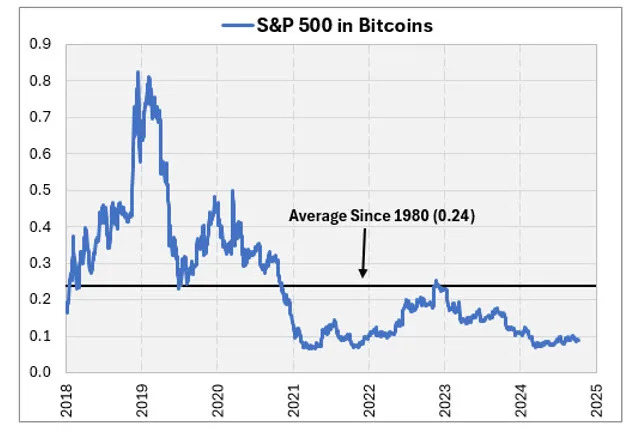
Here’s a fun one. Let’s see how the stock market has performed in Bitcoin (BTC). I have bitcoin data back to 2015 when it took about 10 bitcoins to buy the S&P 500 index. I only take the chart back to 2018 since it distorts the chart going back further. After bitcoin’s meteoric rise, the index is now worth less than a tenth of a bitcoin. When priced in bitcoin, the S&P 500 peaked in late 2022 and is down about 64% since then.
Tying it All Together
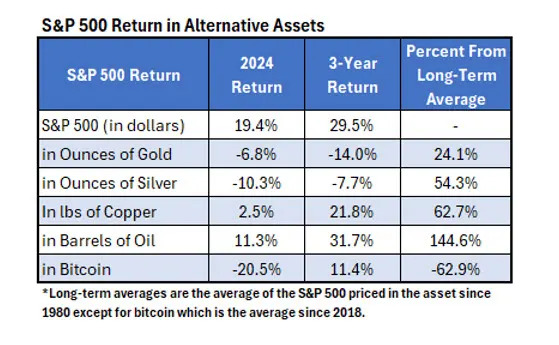
Here’s a summary of how the S&P 500 performed year-to-date and over the past three years when priced in these other assets. Also, I show where the SPX stands compared to its long-term average. Investors have gained about 20% on the year holding the S&P 500. If investors would have given up gold for the index instead of dollars, they would have lost 6.8%. Had they traded in bitcoin, they would be down about 20% in 2024. The S&P 500 sits above its long-term average when priced in every asset, except bitcoin, ranging from 24% above its average in gold to 144% above its average in oil.