Air quality and fluid handling company CECO (NASDAQ:CECO) reported Q4 CY2024 results topping the market’s revenue expectations , with sales up 3.2% year on year to $158.6 million. The company’s full-year revenue guidance of $725 million at the midpoint came in 4.1% above analysts’ estimates. Its non-GAAP profit of $0.27 per share was 19.1% above analysts’ consensus estimates.
Is now the time to buy CECO? Find out in our full research report .
CECO (CECO) Q4 CY2024 Highlights:
Todd Gleason, CECO's Chief Executive Officer commented, “While we acknowledge mixed results in 2024 driven by customer project and market related order delays, we are energized by our fourth quarter record orders bookings of $219 million, which provides incredible momentum moving into 2025. The steady progress we continue to make on expanding margins and upgrading our portfolio through organic and inorganic investments will help us maximize the tremendous opportunities that exist in key growth markets we serve such as power generation, reshoring of industrial manufacturing, global infrastructure and data center expansion.”
Company Overview
Started in a Cincinnati garage, CECO (NASDAQ:CECO) is a global provider of industrial air quality and fluid handling systems.
HVAC and Water Systems
Many HVAC and water systems companies sell essential, non-discretionary infrastructure for buildings. Since the useful lives of these water heaters and vents are fairly standard, these companies have a portion of predictable replacement revenue. In the last decade, trends in energy efficiency and clean water are driving innovation that is leading to incremental demand. On the other hand, new installations for these companies are at the whim of residential and commercial construction volumes, which tend to be cyclical and can be impacted heavily by economic factors such as interest rates.
Sales Growth
Reviewing a company’s long-term sales performance reveals insights into its quality. Any business can have short-term success, but a top-tier one grows for years. Luckily, CECO’s sales grew at a solid 10.3% compounded annual growth rate over the last five years. Its growth beat the average industrials company and shows its offerings resonate with customers, a helpful starting point for our analysis.
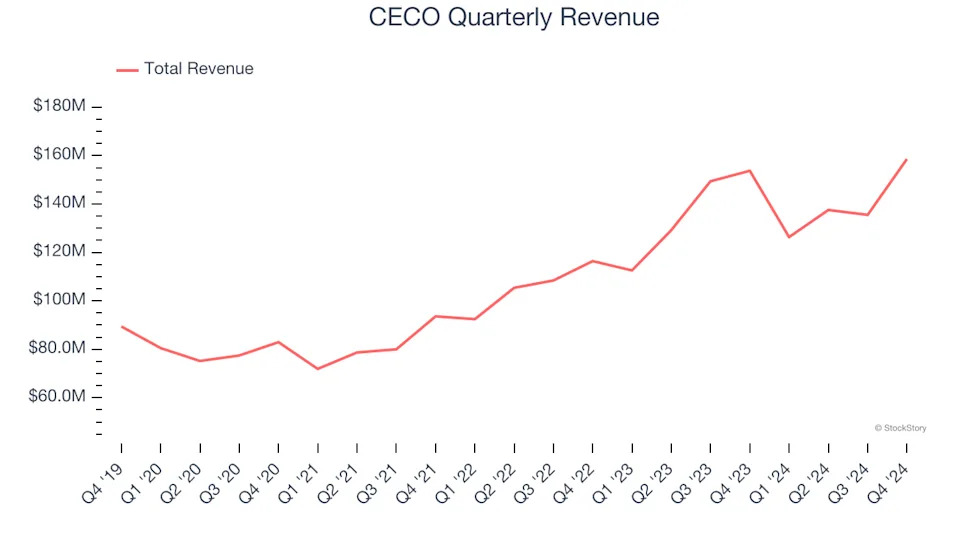
Long-term growth is the most important, but within industrials, a half-decade historical view may miss new industry trends or demand cycles. CECO’s annualized revenue growth of 14.9% over the last two years is above its five-year trend, suggesting its demand was strong and recently accelerated.
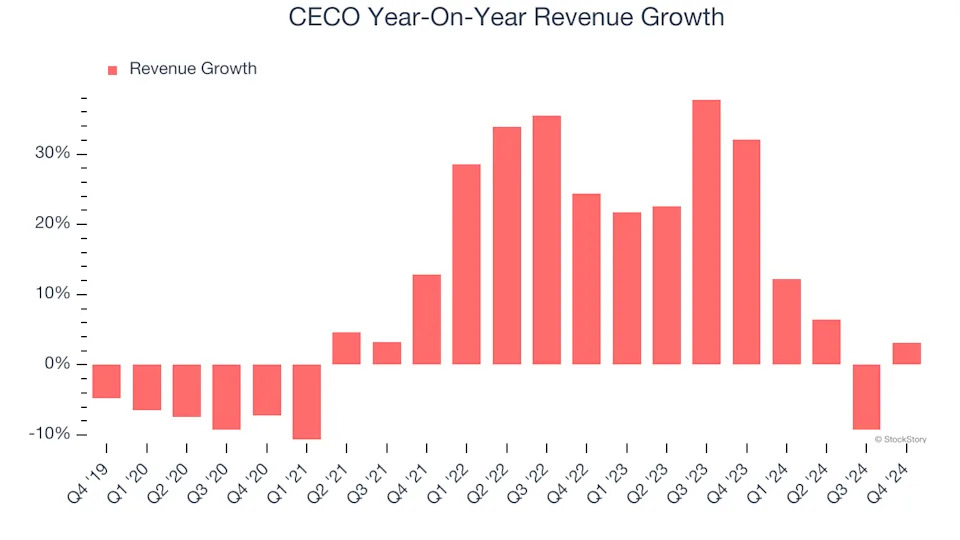
This quarter, CECO reported modest year-on-year revenue growth of 3.2% but beat Wall Street’s estimates by 1.4%.
Looking ahead, sell-side analysts expect revenue to grow 24.4% over the next 12 months, an improvement versus the last two years. This projection is eye-popping and indicates its newer products and services will spur better top-line performance.
Here at StockStory, we certainly understand the potential of thematic investing. Diverse winners from Microsoft (MSFT) to Alphabet (GOOG), Coca-Cola (KO) to Monster Beverage (MNST) could all have been identified as promising growth stories with a megatrend driving the growth. So, in that spirit, we’ve identified a relatively under-the-radar profitable growth stock benefiting from the rise of AI, available to you FREE via this link .
Operating Margin
Operating margin is a key measure of profitability. Think of it as net income - the bottom line - excluding the impact of taxes and interest on debt, which are less connected to business fundamentals.
CECO was profitable over the last five years but held back by its large cost base. Its average operating margin of 5.3% was weak for an industrials business.
On the plus side, CECO’s operating margin rose by 2.1 percentage points over the last five years, as its sales growth gave it operating leverage.
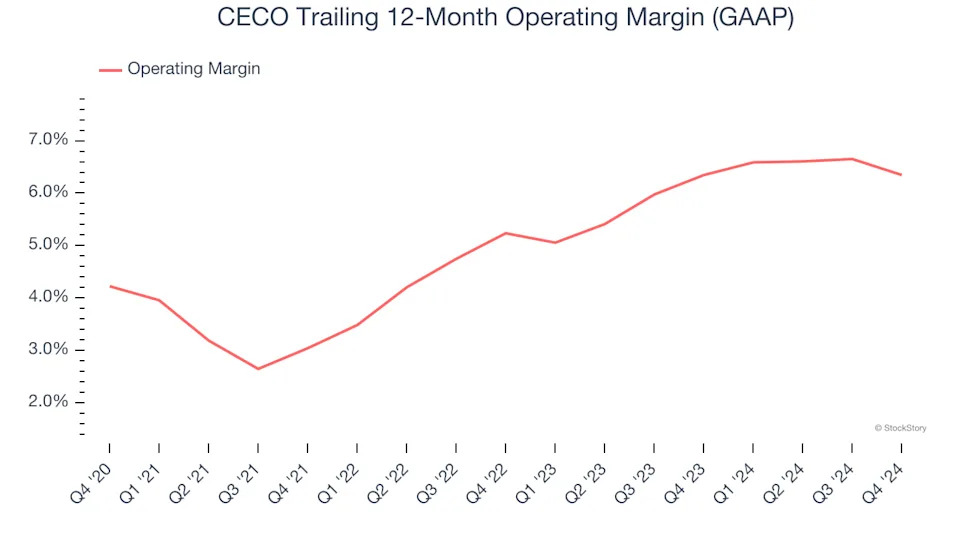
This quarter, CECO generated an operating profit margin of 7.1%, down 1.1 percentage points year on year. Conversely, its revenue and gross margin actually rose, so we can assume it was recently less efficient because its operating expenses like marketing, R&D, and administrative overhead grew faster than its revenue.
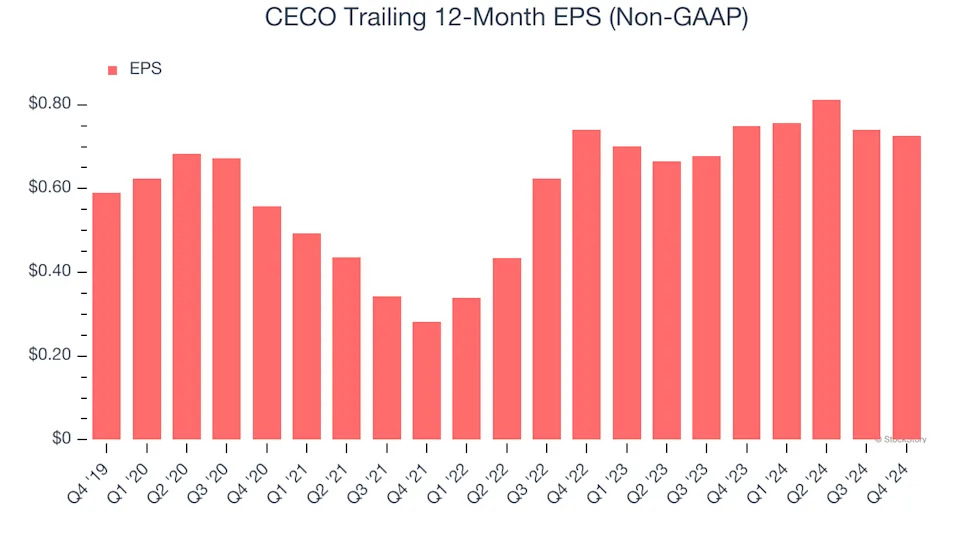
Earnings Per Share
Revenue trends explain a company’s historical growth, but the long-term change in earnings per share (EPS) points to the profitability of that growth – for example, a company could inflate its sales through excessive spending on advertising and promotions.
CECO’s EPS grew at an unimpressive 4.3% compounded annual growth rate over the last five years, lower than its 10.3% annualized revenue growth. However, its operating margin actually expanded during this time, telling us that non-fundamental factors such as interest and taxes affected its ultimate earnings.
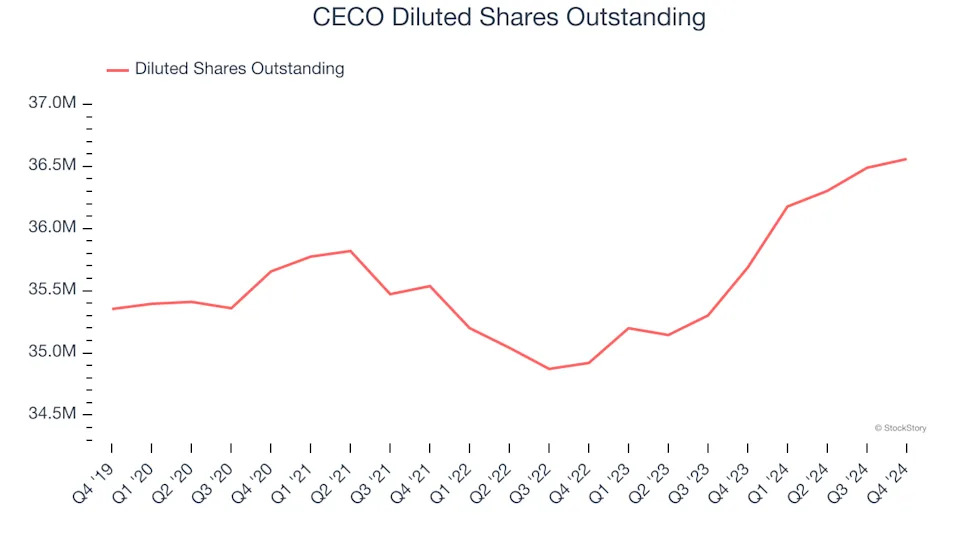
We can take a deeper look into CECO’s earnings to better understand the drivers of its performance. A five-year view shows CECO has diluted its shareholders, growing its share count by 3.4%. This dilution overshadowed its increased operating efficiency and has led to lower per share earnings. Taxes and interest expenses can also affect EPS but don’t tell us as much about a company’s fundamentals.
Like with revenue, we analyze EPS over a shorter period to see if we are missing a change in the business.
For CECO, EPS didn’t budge over the last two years, a regression from its five-year trend. Given the merits in other parts of its business, we’re hopeful it can revert to earnings growth in the coming years.
In Q4, CECO reported EPS at $0.27, down from $0.28 in the same quarter last year. Despite falling year on year, this print easily cleared analysts’ estimates. Over the next 12 months, Wall Street expects CECO’s full-year EPS of $0.73 to grow 56.4%.
Key Takeaways from CECO’s Q4 Results
We were impressed by CECO’s optimistic full-year revenue and EBITDA guidance, which blew past analysts’ expectations. We were also glad its revenue, EPS, and EBITDA beat Wall Street’s estimates. Zooming out, we think this was a good quarter with some key areas of upside. The stock traded up 1.5% to $23 immediately following the results.
Indeed, CECO had a rock-solid quarterly earnings result, but is this stock a good investment here? We think that the latest quarter is just one piece of the longer-term business quality puzzle. Quality, when combined with valuation, can help determine if the stock is a buy. We cover that in our actionable full research report which you can read here, it’s free .